
A stock market index is a measurement tool that tracks the performance of a specific group of stocks, representing a segment of the financial market. Indices serve as benchmarks for investors, fund managers, and economists to evaluate market movements and portfolio performance. Understanding how stock market indices work is essential for anyone looking to invest wisely, as these indexes form the foundation of index funds, ETFs, and countless investment strategies used by millions of Americans.
📊 STATS
• $12.8 trillion is invested in index funds tracking the S&P 500
• 89% of large-cap US equity funds underperformed the S&P 500 over the 10-year period ending 2023
• $18.5 trillion in total US stock market value
• 3,500+ securities tracked across major US indices
• 98% of the S&P 500's market cap is concentrated in its top 100 holdings
Key Takeaways
• Benchmark Tool: Indices measure market segments, not individual stocks
• Weighted Calculations: Most use market-cap weighting; some use price weighting
• Index Funds: Low-cost vehicles that track index performance
• Diversification: Indices provide instant exposure to hundreds of companies
• Performance Metric: Your portfolio's return is meaningless without comparing it to an index
What Is a Stock Market Index?
A stock market index is a numerical representation of a group of stocks that share common characteristics—whether by size, sector, geography, or investment style. Think of it as a report card for a specific portion of the stock market. When someone says "the market is up," they typically refer to a major index like the S&P 500 or Dow Jones Industrial Average.
Indices were created to solve a fundamental problem: the stock market contains thousands of securities, making it impossible to track every price movement. By grouping stocks together and calculating their collective value, investors gain a single number that reflects broader market trends.
Components of a Stock Index
Selection Criteria:
• Market Capitalization: Most indices weight companies by total market value (share price × outstanding shares)
• Liquidity: Stocks must trade with sufficient daily volume
• Listing Exchange: Some indices track only NYSE, NASDAQ, or specific exchanges
• Sector Classification: Sector indices focus on specific industries like technology or healthcare
• Financial Metrics: Quality indices may require minimum earnings, dividends, or revenue thresholds
💡 STAT: The S&P 500 contains only 500 stocks but represents approximately 80% of total US stock market capitalization (S&P Dow Jones Indices, 2024)
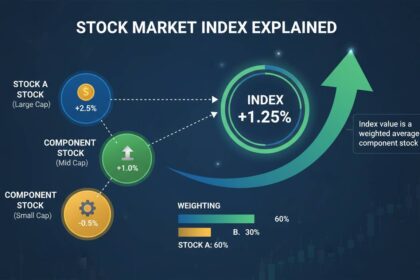
How Index Values Are Calculated
Index calculations vary based on the weighting methodology:
Market-Cap Weighted: The most common method. Companies with larger market values have greater influence. The S&P 500 uses float-adjusted market cap, meaning it considers only shares available for public trading.
Price Weighted: The Dow Jones Industrial Average uses this method, where higher-priced stocks impact the index more, regardless of company size.
Equal Weighted: Each stock receives equal importance, regardless of market cap. The S&P 500 Equal Weight Index gives each of the 500 companies identical 0.2% weightings.
Benefits of Tracking Stock Market Indices
Understanding indices provides several advantages for investors at every experience level.
| Benefit | Impact | Source |
|---|---|---|
| Objective Benchmark | Measure portfolio performance against the broader market | CFA Institute, 2023 |
| Diversification | Access hundreds of companies through single investment | SEC Investor Bulletin, 2024 |
| Lower Costs | Index funds typically charge under 0.10% annually | Morningstar, 2024 |
| Tax Efficiency | Fewer trades mean fewer taxable events | IRS Publication 550 |
| Consistent Returns | Passive indexing historically outperforms most active funds | SPIVA US Report, 2023 |
Key Advantages
Performance Measurement: Without a benchmark, you cannot determine whether your portfolio outperformed or underperformed the market. If your portfolio gained 8% but the S&P 500 rose 12%, you underperformed by 4 percentage points—even though you made money.
Instant Diversification: Buying a single index fund provides exposure to hundreds of companies across multiple sectors. This reduces company-specific risk that comes with holding individual stocks.
Lower Expenses: The average actively managed mutual fund charges 0.75-1.50% in annual fees. Index funds often charge less than 0.10%, meaning more of your money stays invested and compounds over time.
📈 CASE: An investor who put $10,000 in an S&P 500 index fund in 2010 would have approximately $38,000 by early 2024, compared to roughly $26,000 in the average actively managed large-cap fund
Types of Stock Market Indices
Understanding the different index categories helps you choose appropriate benchmarks for your investment goals.
| Factor | Broad Market | Large-Cap | Sector | International |
|---|---|---|---|---|
| Examples | S&P 500, Wilshire 5000 | S&P 100, Dow Jones | Technology Select Sector | MSCI EAFE, FTSE 100 |
| Coverage | 100% of market | Top 100-500 companies | Single industry | Foreign markets |
| Volatility | Moderate | Lower | Higher (concentrated) | Currency risk |
| Best For | Total market exposure | Blue-chip tracking | Thematic investing | Global diversification |
Broad Market Indices
S&P 500: The most widely followed index, tracking 500 of the largest US companies. It represents approximately 80% of US market capitalization and serves as the primary benchmark for most American investors.
Wilshire 5000: Formerly the most comprehensive US index, tracking nearly all publicly traded US companies. Now discontinued, it has been replaced by indices like the S&P Total Market Index.
Dow Jones Industrial Average: One of the oldest indices, containing 30 major US companies. Unlike other indices, it is price-weighted, meaning a $400 stock moves the index more than a $40 stock.
Sector Indices
Technology: NASDAQ-100 Technology Index tracks the largest tech companies
Healthcare: Health Care Select Sector SPDR Fund (XLV) monitors pharmaceutical and biotech firms
Energy: Energy Select Sector SPDR Fund (XLV) follows oil, gas, and renewable energy companies
Sector indices enable targeted investing in industries you believe will outperform, though they carry higher concentration risk than broad market indices.
International Indices
MSCI EAFE: Tracks developed markets in Europe, Australasia, and the Far East
FTSE 100: The 100 largest companies on the London Stock Exchange
Nikkei 225: Japan's 225 largest publicly traded companies
International indices provide geographic diversification but introduce currency exchange risk and geopolitical considerations.
How to Use Stock Market Indices in Your Investment Strategy
Understanding indices is only the first step. Here's how to apply this knowledge practically.
Prerequisites
- [ ] Brokerage account opened and funded
- [ ] Investment goals and time horizon defined
- [ ] Risk tolerance assessed
- [ ] Basic understanding of stock market mechanics
- [ ] Knowledge of tax-advantaged accounts (401k, IRA)
Steps
1. Choose Your Benchmark
Select an index that matches your investment focus. US large-cap stocks = S&P 500. Total US market = S&P Total Market Index. International = MSCI EAFE. Your benchmark should align with your asset allocation.
⏱ 15 minutes | 💡 Tip: Most investors benefit from using the S&P 500 as their primary benchmark since it represents the largest portion of US market value.
2. Select Your Investment Vehicle
Index mutual funds and exchange-traded funds (ETFs) both track indices. ETFs trade like stocks throughout the day, while mutual funds execute at end-of-day prices.
⚠️ Avoid: Choosing expensive actively managed funds that claim to "beat the market" → Fix: Historical data shows most active managers fail to beat their benchmark over long periods.
3. Understand Total Return vs. Price Return
Total return includes dividend reinvestment; price return does not. The S&P 500 Total Return Index assumes dividends are reinvested, while the S&P 500 Price Index does not. Most investors should use total return figures.
4. Monitor Expense Ratios
Every percentage point in fees reduces your returns. A fund with a 0.50% expense ratio can cost you over $50,000 on a $1 million portfolio over 25 years (assuming 7% annual returns).
5. Rebalance Periodically
If your target allocation is 80% stocks and 20% bonds, rebalance when stocks grow to 85% or shrink to 75%. This forces you to sell winners and buy losers, maintaining your intended risk level.
Troubleshooting:
| Problem | Fix |
|---|---|
| Index fund tracks index too loosely | Switch to funds with lower tracking error |
| Can't decide between similar ETFs | Compare expense ratios and trading volumes |
| Index seems too concentrated | Add sector ETFs for more diversification |
| International allocation unclear | Start with 10-20% and adjust based on goals |
Common Mistakes Investors Make With Indices
| Mistake | Impact | Solution |
|---|---|---|
| Chasing Hot Sectors | Buy at peaks, sell during corrections | Stick to asset allocation targets |
| Ignoring Dividends | Understate actual returns by 1-2% annually | Use total return indices |
| Comparing Wrong Benchmarks | Large-cap fund vs. small-cap index | Match fund style to index style |
| Overreacting to Volatility | Sell low, buy high | Maintain long-term perspective |
| Ignoring International Exposure | Miss global diversification benefits | Include foreign indices in portfolio |
⚠️ CRITICAL: The most costly mistake is trying to "time the market" by predicting index movements. Research shows that missing just the 10 best trading days between 2000-2020 would have reduced returns by more than 50%
Prevent:
- Automate contributions through dollar-cost averaging
- Rebalance annually at most
- Ignore short-term noise and focus on long-term trends
Expert Insights
👤 Ben Carlson, Director of Institutional Assets at A Wealth of Common Sense
"Indices have democratized investing in a way that was previously impossible. You can now get broad market exposure for virtually free. The question isn't whether to use indices—it's how much of your portfolio should be in them versus targeted exposures."
👤 Jill B. W. Carlson, Financial Writer and Consultant
"Understanding what an index measures matters as much as the index itself. A tech-heavy index will obviously perform differently than an index weighted toward utilities. Know what you're actually buying."
📊 BENCHMARKS
| Metric | Average Investor | S&P 500 (10-Year) |
|---|---|---|
| Annual Return | 4.5% | 10.5% |
| Expense Ratio | 0.65% | 0.03% |
| Turnover Rate | 75% | <5% |
Tools for Tracking Indices
| Tool | Cost | For | Rating |
|---|---|---|---|
| Yahoo Finance | Free | Real-time quotes, charts | ⭐⭐⭐⭐⭐ |
| Morningstar | Free/Premium | Fund comparison, analysis | ⭐⭐⭐⭐⭐ |
| S&P 500 Website | Free | Official index methodology | ⭐⭐⭐⭐ |
| Bloomberg Terminal | $2,000/month | Professional-grade data | ⭐⭐⭐⭐⭐ |
| Finviz | Free | Visual screening tools | ⭐⭐⭐⭐ |
Top Picks:
• Yahoo Finance: Best free option for daily index tracking and portfolio management
• Morningstar: Superior for comparing index funds and ETFs by expense ratio and performance
• S&P Dow Jones Indices Website: Authoritative source for index methodology and rebalancing schedules
Frequently Asked Questions
What is the difference between the Dow Jones and S&P 500?
The Dow Jones Industrial Average tracks just 30 large US companies and uses price weighting, meaning higher-priced stocks have more influence regardless of company size. The S&P 500 tracks 500 companies using market-cap weighting, where larger companies (by total value) have proportionally greater impact. The S&P 500 is widely considered the more accurate representation of the overall US stock market.
How often is an index updated?
Most major indices calculate values continuously during trading hours, updating multiple times per second. The S&P 500 rebalances quarterly, adding or removing companies based on market cap and other criteria. Some indices, like the Dow, update only when market closes.
Can I buy an index directly?
You cannot buy an index directly because an index is a measurement, not a security. However, you can invest in index funds or ETFs that track specific indices. Examples include Vanguard's S&P 500 ETF (VOO), iShares Core S&P 500 ETF (IVV), and SPDR S&P 500 ETF Trust (SPY).
What is market-cap weighting?
Market-cap weighting assigns each stock a weight proportional to its total market value (share price times outstanding shares). In a market-cap-weighted index, Apple (with a $3 trillion market cap) has significantly more influence than a company with a $10 billion market cap. This method reflects the actual composition of the investable market.
Why do index funds outperform most actively managed funds?
Actively managed funds must charge higher fees to pay for research and portfolio management. These fees create a "head start" that active managers must overcome just to match index performance. Over 10-year periods, approximately 90% of large-cap active managers underperform the S&P 500 after fees .
Conclusion
Stock market indices form the backbone of modern investing, providing the benchmarks we use to measure success and the vehicles we use to achieve market returns. Understanding what indices are, how they're calculated, and which ones align with your goals is fundamental to building wealth through the stock market.
The beauty of indices lies in their simplicity: you don't need to pick individual stocks, predict market movements, or pay high fees to participate in economic growth. By investing in low-cost index funds that track broad market indices like the S&P 500, you can own a slice of America's largest companies with minimal complexity.
Remember that the goal isn't to beat the market—it's to earn market returns while minimizing costs and maintaining discipline through market volatility. Indices make this possible for investors at every level, from those just starting with small monthly contributions to those managing substantial portfolios.
The evidence is clear: indices have delivered approximately 10% average annual returns over the past century, and the lowest-cost way to capture these returns is through index funds. Your investing journey begins with understanding this fundamental truth—and the stock market index is your map to navigate it.